Breaking Down PG&E’s Natural Gas Costs and Rates
Attachment on page 6 provides details on the specific gas areas where costs changed along with the pertinent decision authorizing the cost recovery.We regulate natural gas rates and services of the state’s investor-owned utilities, including those of Pacific Gas and Electric Company (PG&E). In this blog posting we break down the components of PG&E’s gas costs and rates, and offer tips on reducing your bill.
A typical residential PG&E gas bill is comprised of three components:
- Procurement Costs (cost of gas purchased by PG&E for customers): 31% of costs
- Transportation Costs: 62% of costs
- Public Purpose Surcharge: 7% of costs
Procurement costs depend on wholesale gas markets and fluctuate month to month based on national gas market prices. Natural gas prices are a result of national supply and demand conditions. For the current winter, the chart below shows that PG&E procurement rates increased in October 2016 from $0.296 to $0.387 (increase of $0.091/therm) and again in November 2016 by $0.072/therm to $0.459, totaling an increase of $0.163 in a matter of two months. The procurement rate came down in December but from that point increased in January and February 2017. Utilities are not allowed any return or profit on the gas they purchase to sell to customers. They are only authorized to recover the cost of the purchased gas.
Transportation costs are comprised of gas transmission and distribution costs. Gas distribution (or local service) costs are decided in a General Rate Case. For PG&E, gas transmission and storage costs are decided in the Gas Transmission and Storage (GT&S) proceeding. The cost allocation proceedings determine how the utility distributes costs to the different customer classes (i.e., residential, commercial, industrial, etc.). As shown below, the CPUC increased PG&E’s transportation rates in August 2016 pursuant to a GT&S decision (D.16-06-056) in order to fund various utility safety related programs. A subsequent GT&S decision (D.16-12-010) reduced the transportation rates in January 2017 because of various sanctions the CPUC levied on PG&E due to certain past transgressions.
Public purpose surcharge funds certain natural gas-related programs such as energy efficiency, low income assistance, and energy savings assistance and is also adjusted annually on January 1 to reflect changes in volume of gas used. The public purpose charge was $0.102/therm for 2016 and was decreased to $0.096 on January 1, 2017.
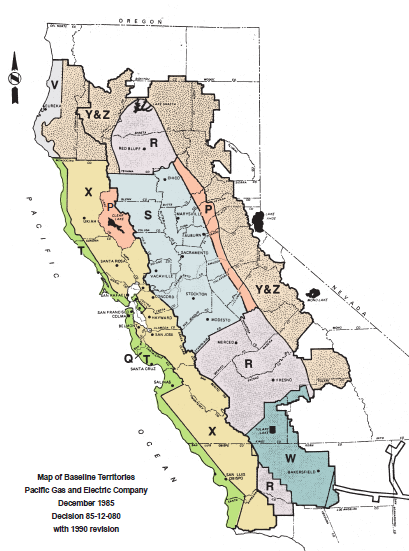
Rates for Baseline Usage: Per statutory requirements, residential gas rates for a basic level of consumption called “baseline” are set at a lower rate. From November through April, baseline rates apply to all usage up to 70 percent of average household usage. Usage above the baseline amount is charged at a higher rate.
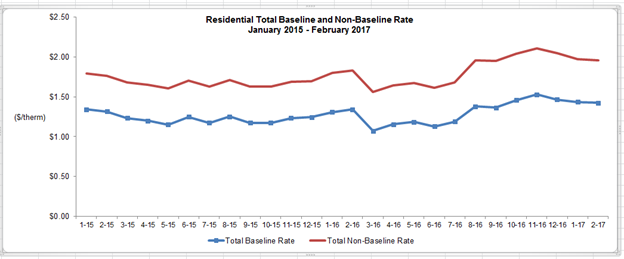
Effect of Weather Conditions: Gas usage is generally higher during cold spells in winter months. The days of cold weather are referred to as heating degree days. The larger the number of heating degree days in a month, the larger the impact on gas bills. When a cold spell hits and customer usage increases, the bills increase not only because more gas was used but also because gas usage above baseline is charged a higher rate. So if a customer uses twice as much gas in a month due to cold weather, the gas bill could be more than double due to the fact a higher rate applies to above baseline consumption. The table below shows baseline and above baseline rates for each month in 2016 and January and February 2017.
Days in a billing cycle: Generally, gas meters are read monthly and the number of days in a billing cycle typically ranges from 28 to 33 days. A customer’s monthly bill can be higher depending on the number of days in the billing cycle.
Table A: PG&E Residential (Non-CARE) Customer Gas Rates Oct. 2015-Feb. 2017
| A | B | C | D | |||
|
Procurement ($/Therm) |
Public Purpose Surcharge ($/therm) | Baseline Transportation ($/therm) | Non-Baseline Transportation ($/therm | Total Baseline Rate ($/therm) (A+B+C) | Total Non-Baseline Rate ($/therm) (A+B+D) | |
|
Oct-15 |
$0.326 | $0.090 | $0.760 | $1.216 | $1.176 | $1.632 |
| Nov-15 | $0.385 | $0.090 | $0.760 | $1.216 | $1.234 | $1.690 |
| Dec-15 | $0.394 | $0.090 | $0.760 | $1.216 | $1.244 | $1.700 |
| Jan-16 | $0.391 | $0.102 | $0.816 | $1.305 | $1.308 | $1.798 * |
| Feb-16 | $0.423 | $0.102 | $0.816 | $1.305 | $1.341 | $1.831 |
| Mar-16 | $0.153 | $0.102 | $0.816 | $1.305 | $1.071 | $1.561 |
| Apr-16 | $0.236 | $0.102 | $0.816 | $1.305 | $1.153 | $1.643 |
| May-16 | $0.266 | $0.102 | $0.816 | $1.305 | $1.184 | $1.674 |
| Jun-16 | $0.210 | $0.102 | $0.816 | $1.305 | $1.127 | $1.617 |
| Jul-16 | $0.272 | $0.102 | $0.816 | $1.305 | $1.190 | $1.679 |
| Aug-16 | $0.311 | $0.102 | $0.968 | $1.549 | $1.381 | $1.962 * |
| Sep-16 | $0.296 | $0.102 | $0.968 | $1.549 | $1.366 | $1.947 |
| Oct-16 | $0.387 | $0.102 | $0.968 | $1.549 | $1.457 | $2.038 |
| Nov-16 | $0.459 | $0.102 | $0.968 | $1.549 | $1.529 | $2.110 |
| Dec-16 | $0.394 | $0.102 | $0.968 | $1.549 | $1.464 | $2.045 |
| Jan-17 | $0.453 | $0.096 | $0.888 | $1.421 | $1.437 | $1.970 * |
| Feb-17 | $0.443 | $0.096 | $0.888 | $1.421 | $1.426 | $1.959 |
*CPUC-authorized rate change to transportation or public purpose charge.
PG&E Residential (Non-CARE) Customer Gas Rates October 2015-February 2017
Ways to Reduce Your Gas Bill: There are various programs available to help customers lower their gas bills. Among these are the California Alternate Rates for Energy (CARE) program, which provides a rate discount for qualifying low income customers, and the Balanced Payment Plan program for level bill payments over the course of a year. You can find out about other consumer programs on our website.
Gas Cost Recovery: PG&E’s total authorized gas cost recovery (i.e. revenue requirement) was approx. $3.9 billion as of January 1, 2016. As of January 1, 2017, it is approx. $4.6 billion which represents an increase of $654 million. The biggest driver of the increase was the revenue requirement authorized in PG&E’s recent Gas Transmission and Storage (GT&S) rate case proceeding for various safety related programs.
Because much of the infrastructure used to deliver gas is long lived and requires high level of capital spending, many CPUC decisions affect cost recovery over a period of years. Therefore some changes that were put in rates in 2016 were decided by CPUC decisions issued prior to 2016. Likewise, some decisions issued in 2016 will have effect on costs beyond 2016. The cost changes incorporated in rates in 2016 reflect CPUC decisions issued in 2016 and prior to 2016. This fact sheet describes revenue requirement changes that were authorized to go into rates in 2016 and January 1, 2017.
The amount the utility needs to collect in a certain period to recover authorized costs can change depending on whether the sales level resulted in an under-collection or over-collection. Utility rates are set based on a forecast of sales. Any under-recovery or over-recovery resulting from the actual sales being different from the forecast is booked in a balancing account. Sometimes rates may change not because of any change in cost recovery but because of the under or over recovery.
Table B: Comparison of PG&E’s gas revenue requirements on January 1, 2016 and January 1, 2017
| $ in 000s | January 1, 2016 | January 1, 2017 | Change |
| Distribution Revenues in Rates | $1,794,494 | $1,786,773 | -$7,721 |
| Transportation Forecast costs and Balances | $498,398 | $281,622 | -$216,776 |
| GT&S Revenue Requirement | $544,993 | $1,128,133 | $583,140 |
| Public Purpose Program costs | $275,080 | $267,938 | -$7,142 |
| Implementation Plan | $0 | $176,735 | $176,735 |
| Core Procurement costs | $843,944 | $969,369 |
$125,425 |
| Total Gas Revenue Requirement in Rates | $3,956,909 | $4,610,570 | $653,661 |
Map of Baseline Zones