Electric Affordability
The CPUC closely tracks the factors that drive electric rates for California customers. This page provides updated information on electric rate trends across the large electric investor-owned utilities in the state as well as cost drivers that have increased electric rates since 2021.
Cost Drivers
The drivers of electricity costs in California are:
- Delivery: The portion of the bundled* rate associated with operating, maintaining, and improving the transmission and distribution grid, excluding amounts classified as wildfire- related.
- Wildfire-Related: The portion of the bundled rate associated with wildfire mitigation, including vegetation management and grid hardening, and wildfire liability costs, including insurance, claims, and catastrophic-event costs.
- Procurement: The portion of the bundled rate that recovers the cost of generating or purchasing electricity and related generation capacity for bundled customers.
- Public Purpose Programs (PPP): The portion of the bundled rate that supports energy efficiency, low-income assistance, research and development, and other state-mandated public-purpose programs.
*Bundled IOU customers take all services–generation, transmission, and distribution services–from the IOU; whereas unbundled customers take transmission and distribution services from the IOU, with generation service provided by a separate load-serving entity, such as a community-choice aggregator.
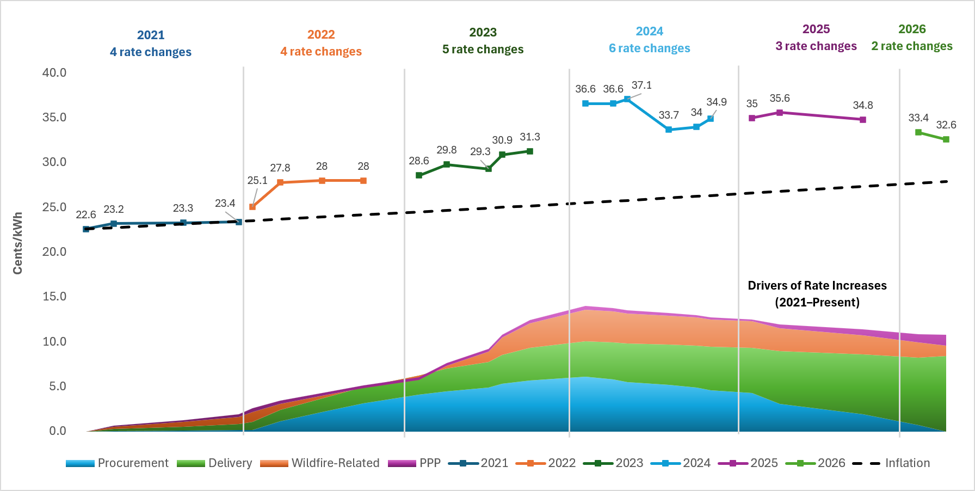
Pacific Gas & Electric (PG&E) Rate Trend
- PG&E average rates increased by 45% since 2021: Between January 1, 2021, and March 1, 2026, PG&E average electric rates increased by approximately 45 percent. If rates had increased at the rate of inflation, this increase would have been about 23 percent. The cost drivers contributing to rate increases since 2021 are shown in the stacked area chart below the line graph.
- PG&E rates have grown faster than inflation: Rates have generally remained higher than what they would have been if they had increased at the rate of inflation as shown by the colored lines being above the black line. Rates increased by an average of 9 percent per year compared to an average inflation rate of 4.2 percent over the same period.
- Recently, rates have decreased compared to prior years: PG&E may implement rate changes throughout the year as electric system costs are added to or are removed from electric rates. Recently, PG&E has implemented rate decreases as previously approved costs have fallen out of rates. For more information about what makes PG&E’s rates increase or decrease, see our Rates Q&A.
Southern California Edison (SCE) Electric Rate Trend
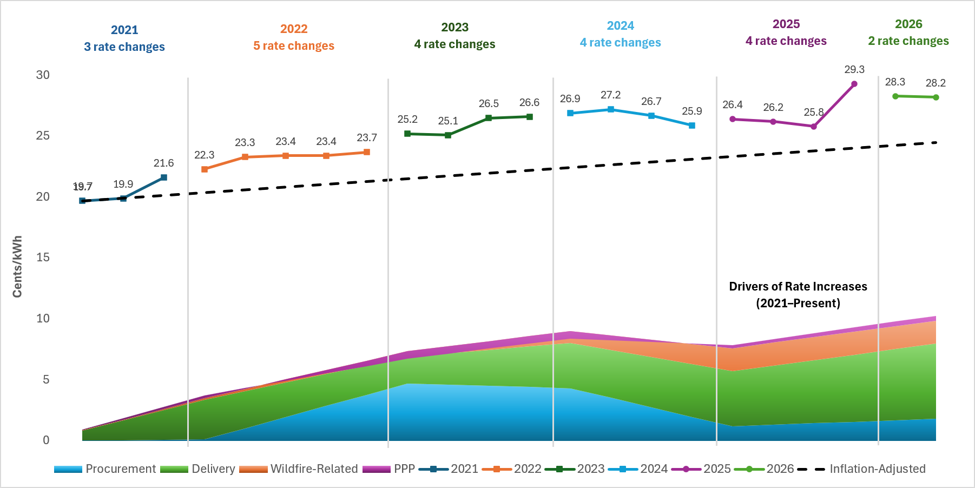
- SCE average rates increased by 43% since 2021: Between January 1, 2021, and June 1, 2026, SCE average electric rates increased by approximately 43 percent. If rates had increased at the rate of inflation, this increase would have been about 23 percent. The cost drivers contributing to rate increases since 2021 are shown in the stacked area chart below the line graph.
- SCE rates have grown faster than inflation: Rates have generally remained higher than what they would have been if they had increased at the rate of inflation as shown by the colored lines being above the black line. Rates increased by an average of 8 percent per year compared to an average inflation rate of 4.2 percent over the same period.
- Recently, rates have decreased compared to prior years: SCE may implement rate changes throughout the year as electric system costs are added to or are removed from electric rates. Recently, SCE has implemented rate decreases as previously approved costs have fallen out of rates. For more information about what makes SCE’s rates increase or decrease, see our Rates Q&A.
San Diego Gas & Electric Rate Trend
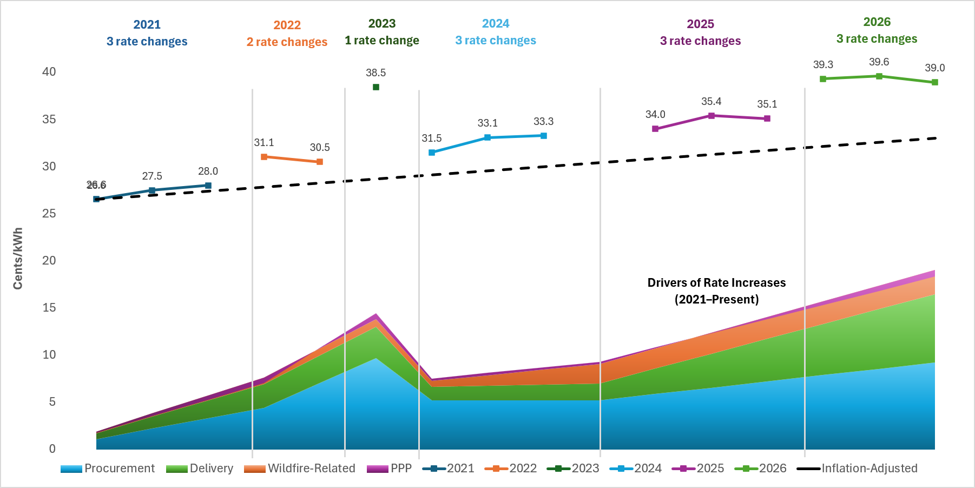
- SDG&E average rates increased by 47% since 2021: Between January 1, 2021, and June 1, 2026, SDG&E average electric rates increased by approximately 47 percent. If rates had increased at the rate of inflation, this increase would have been about 23 percent. The cost drivers contributing to rate increases since 2021 are shown in the stacked area chart below the line graph.
- SDG&E rates have grown faster than inflation: Rates have generally remained higher than what they would have been if they had increased at the rate of inflation as shown by the colored lines being above the black line. Rates increased by an average of 9 percent per year compared to an average inflation rate of 4.2 percent over the same period.
- Recently, rates have decreased compared to prior years: SDG&E may implement rate changes throughout the year as electric system costs are added to or are removed from electric rates. Recently, SDG&E has implemented rate decreases as previously approved costs have fallen out of rates. For more information about what makes SDG&E’s rates increase or decrease, see our Rates Q&A.
Related Pages
What is a General Rate Case (GRC)?
Understanding How the CPUC Processes a General Rate Case
Protecting California Electricity Customers - CPUC Transmission Advocacy at FERC
People who Power the Process: Electric General Rate Case Program and Project Supervisor
People who Power the Process: Achintya Madduri, CPUC Supervisor, Rate Analysis Section